In the fast-paced world of social media, it's easy to get lost chasing follower counts and likes. But what truly defines success? The answer lies in tracking the right metrics. Understanding the key performance indicators for social media is the difference between posting into the void and building a strategy that drives tangible business results. It transforms your social channels from a content stream into a powerful engine for brand growth, lead generation, and customer loyalty.
This guide moves beyond surface-level data to explore the eight most crucial KPIs that every marketer, brand, and creator needs to master. We will dissect each indicator, providing not just definitions but also the specific formulas, industry benchmarks, and practical optimisation techniques you can implement immediately.
Prepare to leave vanity metrics behind and start measuring what truly matters. By the end of this article, you will be equipped to analyse your performance accurately, justify your social media spend, and make data-driven decisions that deliver a genuine return on investment. Let's delve into the metrics that will sharpen your strategy and amplify your impact.
1. Engagement Rate
Engagement rate is one of the most vital key performance indicators for social media because it measures the active participation your content generates relative to your audience size. While reach and impressions show how many people saw your content, engagement reveals how many people interacted with it. This metric signals that your content is resonating, building a community, and capturing attention, not just passing through a feed.
How to Calculate Engagement Rate
You can calculate this KPI in two primary ways:
- Engagement Rate by Reach (ERR): This is often the more accurate measure as it calculates engagement based on the actual number of people who saw your post. The formula is:
(Total Engagements / Reach per Post) x 100. - Engagement Rate by Followers (ERF): This method calculates engagement against your total follower count, which is useful for gauging the general responsiveness of your entire audience. The formula is:
(Total Engagements on a Post / Total Followers) x 100.
Engagements typically include likes, comments, shares, and saves. High engagement rates are favoured by platform algorithms, often leading to increased organic reach.
Actionable Tips for Optimisation
To improve your engagement rate, focus on creating content that prompts a reaction.
- Spark Conversations: Ask direct questions in your captions or create polls in Stories to encourage comments and active participation.
- Time Your Posts: Use your platform’s analytics to identify when your audience is most active and schedule your content to be published during these peak times.
- Create Shareable Value: Focus on content that is educational, entertaining, or inspiring. Checklists, quick tutorials, and relatable memes are highly shareable formats.
- Respond Quickly: Aim to reply to comments within the first hour of posting. This immediate interaction can boost your post's visibility in the algorithm and encourages more comments.
Key Insight: A high engagement rate is a direct indicator of content quality and audience health. Brands like Duolingo excel on TikTok by creating humorous, trend-aware content that achieves engagement rates between 5-10%, proving that understanding the platform’s culture is crucial.
Benchmarks and Interpretation
Engagement rates vary significantly by platform, as certain networks are designed for different types of interaction. The following bar chart illustrates typical benchmark ranges you should aim for.
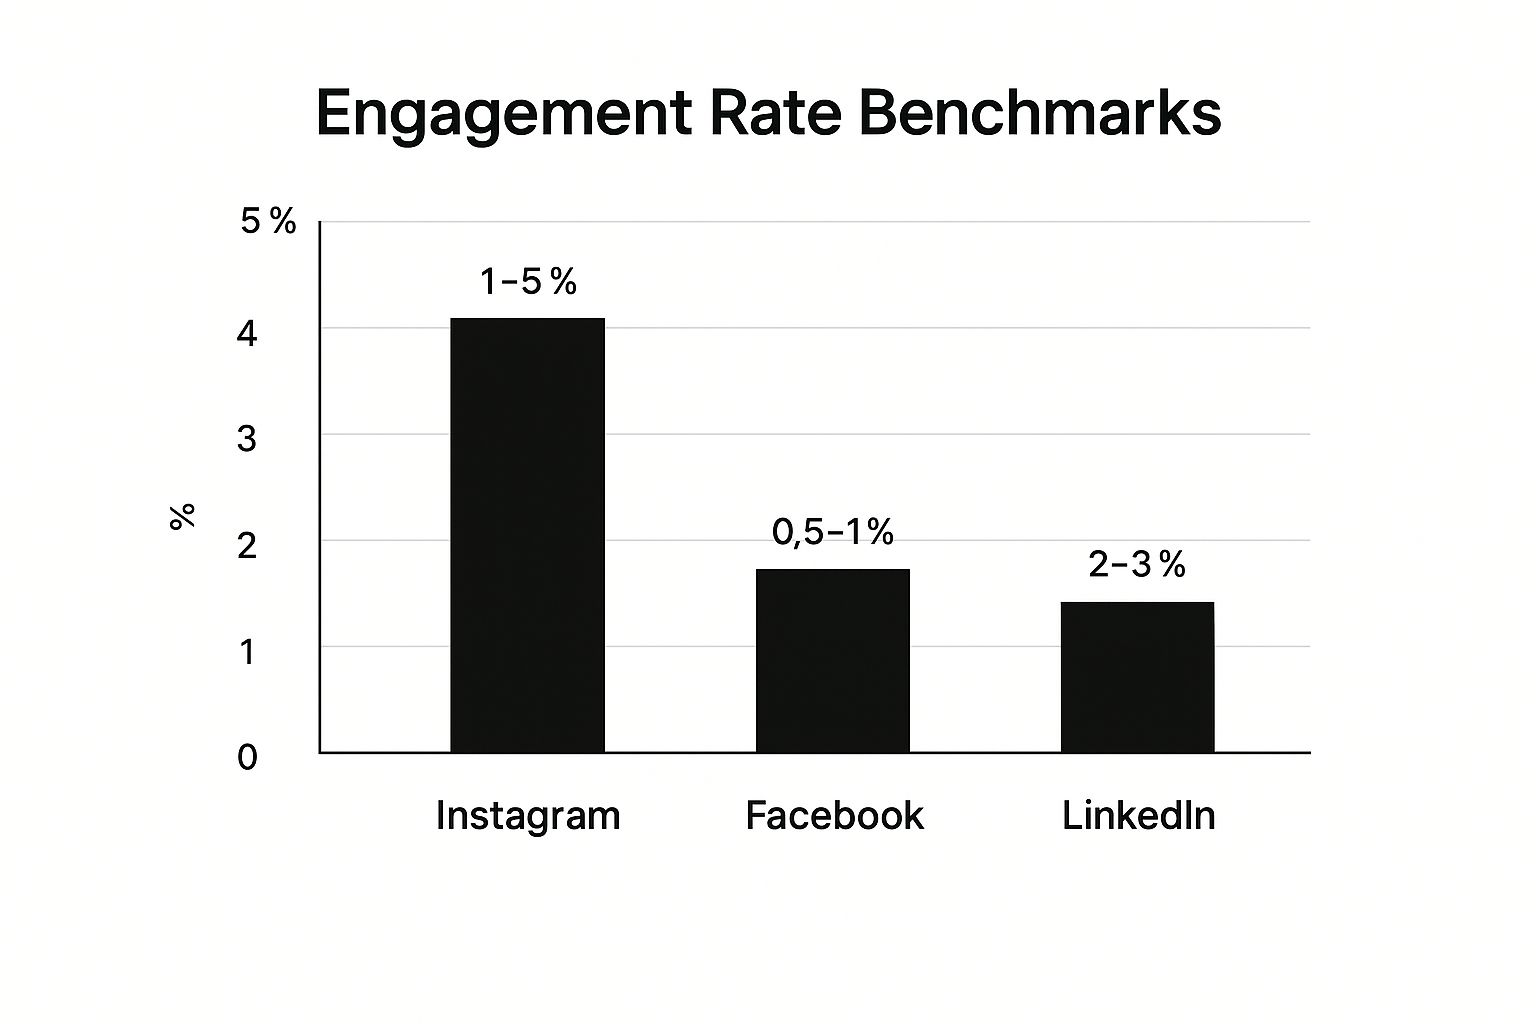
This chart shows that professional networks like LinkedIn and visual-first platforms like Instagram naturally foster higher engagement compared to broader platforms like Facebook. Use these benchmarks not as rigid rules, but as a starting point to measure and improve your own performance over time.
2. Reach and Impressions
Reach and impressions are fundamental key performance indicators for social media that measure your brand’s visibility. Reach quantifies the unique number of users who saw your content, indicating the breadth of your distribution. Impressions, on the other hand, count the total number of times your content was displayed, which can include multiple views by the same person. Together, they reveal not just how wide your audience is, but also how frequently your content is being shown.

How to Calculate Reach and Impressions
These metrics are typically provided directly within each social media platform’s native analytics dashboard. However, understanding their relationship is key:
- Reach: The total number of unique accounts that viewed a specific post or your content over a period. This is a simple count.
- Impressions: The total number of times a post was displayed in users' feeds. A high impressions-to-reach ratio suggests your content was shown to the same users multiple times, which can indicate high relevance or paid promotion.
Tracking these KPIs helps you understand your brand awareness and potential audience size, which are crucial top-of-funnel goals.
Actionable Tips for Optimisation
To maximise your reach and impressions, you need to focus on content discoverability and shareability.
- Use Hashtags Strategically: Research and use a mix of broad, niche, and branded hashtags to expose your content to new, relevant audiences who aren't yet following you.
- Encourage Sharing: Create content that people feel compelled to share, such as insightful infographics, emotional stories, or valuable checklists. Actively ask your audience to share posts that they find useful.
- Leverage Influencer Partnerships: Collaborate with influencers in your niche to tap into their established audiences and instantly amplify your reach.
- A/B Test Content Formats: Experiment with different formats like video, carousels, and single images to identify which types your audience prefers and the algorithm prioritises.
Key Insight: Strong reach is the foundation of all other social media goals. Spotify's annual "Wrapped" campaign is a masterclass in organic reach; it transforms user data into highly personal and shareable content, enabling millions of users to become brand advocates and exponentially increasing its visibility.
Benchmarks and Interpretation
Reach and impressions are highly variable, influenced by follower count, content quality, and algorithm changes. A key diagnostic metric is the impressions-to-reach ratio. If your impressions are only slightly higher than your reach (e.g., a 1.1:1 ratio), it means most people saw your content just once. A significantly higher ratio (e.g., 2:1 or more) signals that your existing audience is seeing your content multiple times, which can be a sign of very engaging content or a focused paid ad campaign. Monitor your average reach per post and aim for steady growth over time as a primary indicator of a healthy and expanding social media presence.
3. Click-Through Rate (CTR)
Click-Through Rate (CTR) is one of the most direct key performance indicators for social media for measuring how effectively your content persuades your audience to take action. It quantifies the percentage of people who click a specific link in your post, bio, or ad compared to the total number who saw it. While engagement shows interest, CTR demonstrates intent, making it crucial for driving traffic to websites, landing pages, or product listings.
How to Calculate Click-Through Rate
Calculating CTR is straightforward and focuses on the ratio of clicks to views. The primary formula is:
(Total Clicks / Total Impressions) x 100
For instance, if a post with a link receives 5,000 impressions and generates 100 clicks, the CTR would be 2%. This metric directly assesses the performance of your call-to-action (CTA) and the overall appeal of your offer, telling you if your content is compelling enough to make someone leave the social platform.
Actionable Tips for Optimisation
To improve your CTR, you need to make your links irresistible and your CTAs crystal clear.
- Create Curiosity Gaps: Write headlines and captions that pique interest without giving everything away, encouraging users to click to learn more. BuzzFeed excels at this with listicles and quizzes.
- Use Action-Oriented CTAs: Be direct with commands like “Shop Now,” “Download the Guide,” or “Learn More.” This removes ambiguity and tells users exactly what to do next.
- Optimise Link Placement: Test different link locations, such as in your bio, Instagram Stories swipe-ups, or even the first comment on platforms like LinkedIn to maximise visibility without sacrificing reach.
- Use Compelling Visuals: Ensure your images or videos visually hint at the value behind the link. An eye-catching graphic that signals a free resource or an exciting product can significantly boost clicks.
Key Insight: A high CTR is a strong signal that your messaging and offer are perfectly aligned with your audience's needs. Brands like HubSpot consistently achieve a 2-5% CTR on posts promoting blog articles by framing educational content as a solution to a specific problem.
Benchmarks and Interpretation
CTR benchmarks can differ dramatically based on the platform, ad format, and industry. For example, an ad for a limited-time offer will likely have a higher CTR than a link to a general blog post. For Facebook Ads specifically, understanding Facebook Ads CTR benchmarks can help you set realistic expectations and optimise your campaigns.
Generally, a CTR of 1-2% is considered a solid starting point for many platforms. However, your goal should be to establish your own baseline and work on improving it over time through consistent testing of copy, visuals, and CTAs. A rising CTR is a clear indicator that your strategy for driving off-platform traffic is working.
4. Conversion Rate
Conversion rate is among the most business-critical key performance indicators for social media because it directly links social media efforts to tangible outcomes. It measures the percentage of users who complete a desired action after clicking a link in your content, such as making a purchase, subscribing to a newsletter, or downloading a resource. This metric moves beyond engagement to quantify the commercial value and ROI of your social strategy.
How to Calculate Conversion Rate
Calculating conversion rate is straightforward, provided you have tracking set up correctly. The formula focuses on the actions taken by users who arrived from a specific social media channel or campaign.
- Formula:
(Total Conversions / Total Clicks) x 100
A "conversion" is any valuable action you define. For an e-commerce brand, this is a sale. For a B2B company, it might be a webinar registration or a form submission. Tracking these actions requires tools like the Meta Pixel, LinkedIn Insight Tag, and UTM parameters in your links to properly attribute conversions in Google Analytics.
Actionable Tips for Optimisation
To improve your conversion rate, you must create a seamless and persuasive journey from social media post to final action.
- Install Tracking Pixels: Place tracking pixels from platforms like Meta and LinkedIn on your website. This is essential for monitoring conversions and enabling powerful retargeting campaigns.
- Use UTM Parameters: Tag all social media links with unique UTM parameters to accurately track which platforms, campaigns, and posts are driving traffic and conversions in your analytics software.
- Create Dedicated Landing Pages: Send traffic from social campaigns to dedicated, high-relevance landing pages rather than your homepage. This ensures message consistency and reduces friction.
- A/B Test Your Calls-to-Action: Experiment with different calls-to-action (CTAs), headlines, and offers to discover what motivates your audience most effectively.
Key Insight: A strong conversion rate proves that your social media is not just building a community but is actively driving business growth. Dollar Shave Club’s early viral video campaign famously led to 12,000 new orders in just 48 hours, demonstrating how compelling content can directly trigger massive conversions.
Benchmarks and Interpretation
Conversion rates are highly variable and depend on the industry, offer, and audience temperature (cold vs. warm traffic). While a general benchmark for e-commerce is often cited as 1-2%, this can be much higher for simpler actions like an email sign-up.
The most important practice is to benchmark against your own historical performance. Focus on incremental improvements over time rather than chasing a universal standard. Analysing your own data will reveal your most profitable channels and campaigns. You can find out more by exploring other social media performance indicators on trustypost.ai.
5. Follower Growth Rate
Follower growth rate is a crucial key performance indicator for social media because it measures the speed at which your audience is expanding, not just its current size. This metric provides a dynamic view of your brand's momentum and content appeal. Tracking growth rate instead of the absolute follower count offers context, showing whether your audience acquisition strategies are effective relative to your existing base and preventing stagnation.
How to Calculate Follower Growth Rate
Calculating this KPI requires tracking your net new followers over a specific period and comparing it to your total audience size.
- The formula is:
(Net New Followers / Total Followers at the Start of Period) x 100.
Net new followers are your new followers gained minus any followers lost during that period (e.g., a month or a quarter). A positive rate indicates your audience is growing, while a negative rate signals a potential issue with your content or strategy. This percentage-based metric allows for a fair comparison of growth across accounts of different sizes.
Actionable Tips for Optimisation
To improve your follower growth rate, focus on strategies that attract and retain a relevant audience.
- Optimise Your Profile: Ensure your bio clearly states your value proposition and includes relevant keywords so new users understand why they should follow you.
- Collaborate Strategically: Partner with influencers or complementary brands whose audiences align with yours to tap into new, relevant follower pools.
- Run Targeted Giveaways: Create contests that require follows and shares, but ensure the prize is highly relevant to your ideal audience to attract genuine long-term followers.
- Cross-Promote Your Channels: Encourage followers on one platform to follow you on another. For example, direct your email subscribers or LinkedIn connections to your Instagram page. Learn more about how to grow your business page on linkedin.com.
Key Insight: Sustainable growth is more valuable than viral spikes. Patagonia maintains a steady 2-3% monthly growth by consistently producing purpose-driven content that resonates deeply with its niche audience, proving that a strong brand identity is a powerful magnet for loyal followers.
Benchmarks and Interpretation
Follower growth rates differ significantly based on the platform, industry, and the maturity of your account. New or small accounts can often achieve higher percentage growth rates compared to large, established ones. For instance, a TikTok account leveraging a viral trend might see a 50% monthly growth, while a well-established B2B brand on LinkedIn might aim for a consistent 2-5% growth. Use this KPI to ensure your audience is expanding and adjust your content and promotion tactics if growth stalls or declines.
6. Share of Voice (SOV)
Share of Voice (SOV) is a crucial competitive metric among the key performance indicators for social media, measuring your brand's visibility against your rivals. It quantifies how much of the conversation within your industry or around specific topics your brand owns. A high SOV indicates strong brand awareness and signifies that your social media presence is successfully capturing audience attention in a crowded marketplace.
How to Calculate Share of Voice
SOV is typically tracked using social listening tools and is calculated by comparing your brand's mentions to the total mentions across your competitive landscape.
- The Formula:
(Your Brand Mentions / Total Industry or Competitor Mentions) x 100.
Total mentions include your brand plus all your defined competitors. For example, if your brand was mentioned 200 times and the total mentions for you and three key competitors were 1,000, your SOV would be 20%. This KPI helps you understand your market position in real-time.
Actionable Tips for Optimisation
To increase your Share of Voice, you must actively and strategically insert your brand into relevant conversations.
- Define Your Arena: Carefully select a focused set of direct competitors. Tracking against the entire market can dilute insights; focus on the rivals you truly battle for customer attention with.
- Utilise Social Listening: Employ tools like Sprout Social or Brandwatch to automate the tracking of brand, competitor, and industry keyword mentions.
- Create Distinctive Content: Develop a unique brand voice and content style that is instantly recognisable and highly shareable, generating organic mentions that competitors can’t easily replicate.
- Monitor Competitor Campaigns: Track SOV during a competitor’s product launch or major campaign. This can reveal opportunities for you to counter-programme or join a trending conversation.
Key Insight: A high Share of Voice often correlates with market share. Netflix historically dominated streaming SOV until Disney+ launched, capturing 25% of the conversation within its first year by leveraging its massive existing IP, which directly translated to rapid subscriber growth.
Benchmarks and Interpretation
SOV benchmarks are entirely relative to your industry and competitive set. A 10% SOV in a duopoly market like Coca-Cola vs. Pepsi is very different from a 10% SOV in a fragmented industry with dozens of players. The goal is to establish your baseline and aim for steady growth, especially during key campaigns. While we focus on social media, understanding broader strategies can be beneficial. For insights into improving your Share of Voice in search engine optimisation, consider exploring strategies to boost your Share of Voice. Analysing sentiment alongside volume provides a more complete picture, ensuring your visibility is positive.
7. Customer Response Time
Customer response time is a crucial metric among the key performance indicators for social media because it measures how quickly your brand addresses customer inquiries, comments, and messages. This KPI directly impacts customer satisfaction and brand perception, as today's consumers expect rapid, almost immediate, assistance on social channels. A prompt response shows you value your customers, builds trust, and can be the deciding factor in retention and loyalty.
How to Measure Customer Response Time
Tracking this KPI involves calculating the average time it takes for your team to provide an initial reply to a customer interaction. Most social media management platforms automate this calculation.
- Average Response Time: This is the total time taken to respond to all inquiries over a specific period, divided by the number of responses. The formula is:
Total Time to Respond / Total Number of Responses. - First Response Time (FRT): This measures the time elapsed between when a customer first submits an inquiry and when a representative first provides a response. This is often the most critical metric for customer satisfaction.
Monitoring these times helps you identify bottlenecks in your customer service process and ensure you are meeting audience expectations for timely support.
Actionable Tips for Optimisation
To decrease your customer response time and improve customer satisfaction, focus on efficiency and preparedness.
- Utilise Unified Inboxes: Use social media management tools like Sprout Social or Hootsuite to consolidate all incoming messages into a single, manageable stream.
- Create Response Templates: Develop pre-written templates for frequently asked questions. This saves time, but ensure each reply is personalised to the specific customer's query.
- Set Clear Goals: Establish an internal goal for your team, such as responding to all business-hours inquiries within 60 minutes.
- Acknowledge Immediately: If a full answer isn't ready, send a quick reply confirming receipt of the message and letting the customer know when they can expect a detailed response. Strategically planning your content can free up time for these interactions; discover how to schedule your social media posts to create a more efficient workflow.
Key Insight: A swift response time can turn a negative experience into a positive one. Brands like JetBlue, known for their sub-10-minute Twitter response times, have built a reputation for outstanding customer care, proving that social media is a powerful service channel, not just a marketing one.
Benchmarks and Interpretation
Response time expectations vary, but the general rule is "the faster, the better." Studies show that over 40% of consumers who reach out to a brand on social media expect a response within one hour.
This standard sets a clear benchmark for businesses aiming to deliver excellent customer service. Falling short can lead to customer frustration and public complaints, while meeting or exceeding this expectation enhances brand loyalty. Use this one-hour goal as your primary target during business hours and continuously work to reduce it.
8. Cost Per Result (CPR) / Cost Per Acquisition (CPA)
Cost Per Result (CPR) is one of the most critical key performance indicators for social media advertising, as it measures the direct cost of achieving a desired action. A more specific version, Cost Per Acquisition (CPA), focuses solely on the cost to gain a new customer. These metrics are essential for evaluating the financial efficiency of your campaigns, ensuring a positive return on investment, and making data-driven decisions about budget allocation.
How to Calculate Cost Per Result / Acquisition
Calculating this KPI is straightforward and reveals the real-world cost of your marketing efforts. It provides a tangible value to measure campaign success against business goals.
- Cost Per Result (CPR): This is a versatile metric that can be adapted to various campaign objectives, like leads, clicks, or app installs. The formula is:
(Total Amount Spent / Total Number of Results). - Cost Per Acquisition (CPA): This formula is used specifically for tracking the cost of securing a paying customer. The formula is:
(Total Amount Spent / Total Number of New Customers).
A low CPR or CPA indicates that your ad creative, targeting, and landing page are highly optimised and efficient at converting viewers into taking the desired action.
Actionable Tips for Optimisation
To lower your CPR/CPA and improve marketing efficiency, focus on refining your entire conversion funnel.
- Test and Iterate: Continuously test different ad creatives, headlines, audience segments, and placements to identify the combinations that deliver the lowest cost.
- Optimise Landing Pages: Ensure your landing page experience is seamless, with a clear call-to-action and fast load times. A poor user experience will increase your acquisition costs.
- Leverage Lookalike Audiences: Create lookalike audiences based on your existing high-value customers. These audiences are more likely to convert at a lower cost.
- Implement Retargeting: Target users who have already engaged with your brand but have not yet converted. These warm leads are often significantly cheaper to acquire.
Key Insight: A powerful strategy is to benchmark your CPA against your Customer Lifetime Value (LTV). A healthy business model often aims for a 3:1 LTV to CPA ratio, meaning a customer's total value is at least three times the cost it took to acquire them.
Benchmarks and Interpretation
CPR and CPA benchmarks fluctuate widely based on industry, campaign objective, and audience competition. An e-commerce brand might aim for a £20-£50 CPA, whereas a B2B SaaS company might find a £200-£500 CPA profitable due to a higher customer lifetime value. Mobile app install campaigns often average £2-£5, while a qualified B2B lead might cost between £50-£150. Use these figures as a guide, but always prioritise your own business economics to define what constitutes a successful CPA for your specific situation.
Key Metrics Comparison of 8 Social Media KPIs
| KPI / Metric | Implementation Complexity 🔄 | Resource Requirements ⚡ | Expected Outcomes 📊 | Ideal Use Cases 💡 | Key Advantages ⭐ |
|---|---|---|---|---|---|
| Engagement Rate | Moderate – requires tracking multiple interaction types | Low to Moderate – depends on analytics tools | Measures audience interaction and content resonance | Evaluating content quality and audience connection | Directly indicates content relevance and quality |
| Reach and Impressions | Low – basic platform metrics availability | Low – usually provided by platforms | Measures content visibility and brand awareness | Brand awareness campaigns, content distribution tracking | Easy to track and essential for visibility insights |
| Click-Through Rate (CTR) | Moderate – requires click and impression tracking | Moderate – platforms and link tracking tools | Measures effectiveness of CTAs and traffic-driving | Optimizing ads, CTAs, and website traffic | Direct measure of audience action and intent |
| Conversion Rate | High – needs setup of tracking pixels and attribution | High – technical setup and analytics platforms | Measures business goal completions and ROI | Tracking actual sales, signups, downloads | Directly ties social media to revenue and business |
| Follower Growth Rate | Low to Moderate – simple follower tracking | Low – platform native data sufficient | Measures audience expansion speed and brand momentum | Assessing brand health and audience growth | Shows growth trend relative to account size |
| Share of Voice (SOV) | High – requires social listening tools and competitive data | High – social listening subscriptions | Measures brand visibility vs competitors | Competitive analysis, market position benchmarking | Provides context on brand standing in market |
| Customer Response Time | Moderate – requires tracking response timestamps | Moderate to High – staffing and monitoring tools | Measures speed of customer interaction responses | Customer service and reputation management | Directly impacts customer satisfaction and loyalty |
| Cost Per Result / CPA | Moderate to High – requires ad spend and conversion data | Moderate to High – ad platforms and analytics | Measures cost efficiency and profitability | Budget optimization, campaign ROI, paid acquisition | Clear measure of marketing spend efficiency |
From Data to Decisions: Activating Your Social Media Insights
You've now explored the essential framework for measuring social media success. From the nuanced signals of Engagement Rate to the hard financial data of Cost Per Acquisition, each of the eight key performance indicators for social media we've discussed offers a unique lens through which to view your performance. However, the true power of these metrics is not realised in isolation; it emerges when you synthesise them into a coherent narrative about your brand's digital journey.
The ultimate goal is to move beyond simply collecting data and toward creating a dynamic feedback loop. Your Reach and Impressions tell you who you’re connecting with, your Click-Through Rate shows what messages resonate, and your Conversion Rate confirms the value you’re delivering. When viewed together, these KPIs transform from static numbers on a spreadsheet into a strategic roadmap, guiding every content decision you make.
Turning Measurement into Momentum
Mastering these concepts allows you to build a resilient and agile social media strategy. Instead of guessing which content formats or posting times work best, you can make informed decisions backed by empirical evidence. This data-driven approach is what separates fleeting social media success from sustainable, long-term growth and a tangible return on investment.
A common pitfall is 'analysis paralysis', where the sheer volume of data becomes overwhelming. To avoid this, focus on a select few KPIs that directly align with your most critical business objectives for the current quarter.
- For brand awareness campaigns: Prioritise Reach, Impressions, and Share of Voice. These metrics will give you a clear picture of your visibility within your target market.
- For lead generation goals: Centre your analysis on Click-Through Rate and Conversion Rate. This focuses your efforts on driving tangible actions that fill your sales funnel.
- For community building: Emphasise Engagement Rate and Follower Growth Rate. This ensures you are building a loyal and interactive audience.
Your Path to a Data-Driven Strategy
The journey towards social media mastery is an iterative process of testing, learning, and optimising. Start by selecting three or four of these KPIs that are most relevant to your current goals. Set up a simple tracking dashboard, either through your native social media analytics tools or a dedicated third-party platform, and commit to reviewing your performance on a weekly or bi-weekly basis.
Look for patterns, ask critical questions, and don't be afraid to experiment. If a particular post format consistently drives a high engagement rate, make it a cornerstone of your content calendar. If your customer response time is lagging, reorganise your workflow to address inquiries more promptly. By consistently acting on these insights, you will not only improve your metrics but also build a more profound and valuable connection with your audience, transforming your social media presence from a simple broadcast channel into a powerful engine for business growth.
Ready to streamline your content creation so you can focus more on strategy and analysis? Trustypost uses AI to help you generate high-quality, on-brand social media content in a fraction of the time. Stop staring at a blank page and start scheduling impactful posts that drive results by visiting Trustypost today.