So, what exactly is a Key Performance Indicator (KPI) when we're talking about social media? Think of it as a specific, measurable value that shows you how well your social media efforts are contributing to your core business goals. Instead of getting lost in a sea of data, KPIs are the vital signs you watch closely to check the health and success of your strategy.
What Are Social Media KPIs Anyway?
Let's break this down with a simple analogy. Imagine your social media strategy is a road trip, and your main business objective is the final destination. Your car's dashboard gives you all sorts of information—tyre pressure, oil life, trip distance—but you’re really only keeping a close eye on three things: your speed, your fuel level, and your engine temperature. These are your KPIs. They’re the critical gauges that tell you if you're making good progress, efficiently and safely.
In the same way, a social media KPI isn’t just any old number. It's a metric you've hand-picked because it directly connects what you're doing on social media to a meaningful business result. A 'like' is just a metric. But the number of leads you generate from a specific social media campaign? That's a KPI, especially if your goal is to grow your customer base. This distinction is what separates busywork from real, valuable work. To dig deeper into this, you can explore more about social media performance indicators.
From Vague Goals to Tangible Results
Without clear KPIs, big goals like "increase brand awareness" are just wishful thinking. KPIs are what turn these abstract ambitions into a concrete, measurable framework. They give you the hard evidence you need to justify your budget, tweak your content strategy, and prove you're delivering a solid return on investment.
This diagram perfectly illustrates how business goals should flow down to specific KPIs, which in turn creates a feedback loop to guide your performance.
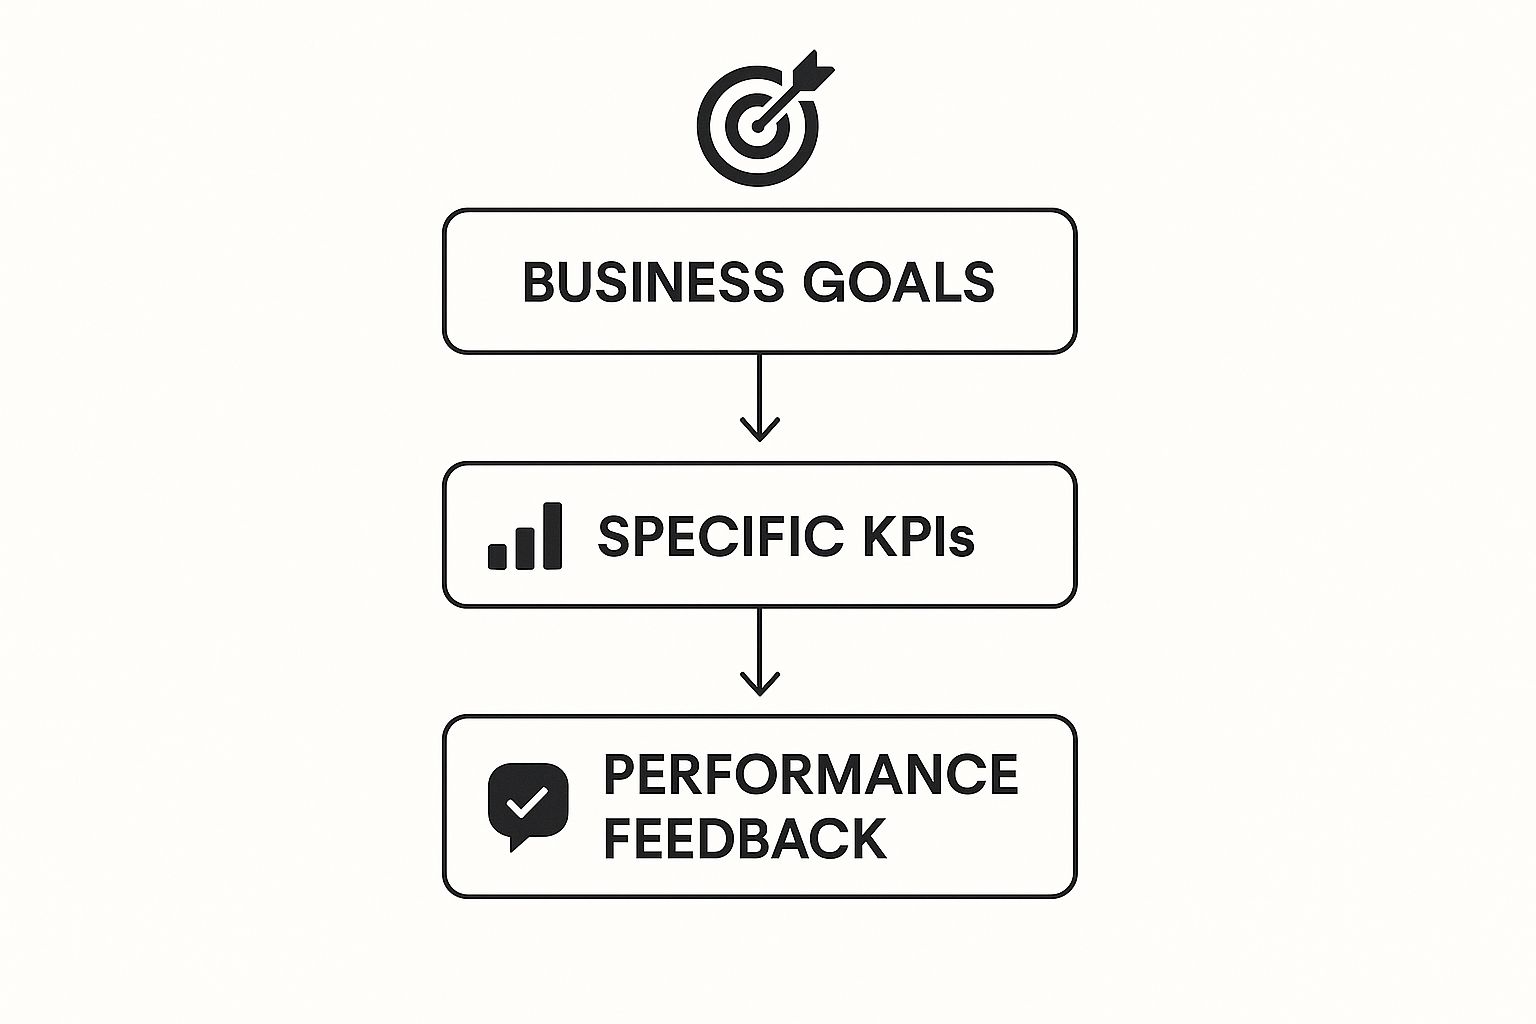
As you can see, effective measurement always starts from the top. You need to ensure every metric you track is there to support a bigger business objective. To truly understand the value your social channels are bringing in, it’s vital to identify and track the essential lead generation KPIs that link directly back to your bottom line.
In Germany, for example, the continued growth in social media advertising is a direct response to consumers wanting more authentic and interactive content. This trend really highlights how important it is to pick KPIs that measure genuine engagement and connection, rather than just chasing vanity metrics.
The Three Pillars of Social Media Measurement

Feeling swamped by all the metrics and data points you could be tracking? It's easy to get lost. Let's cut through the noise.
Just about every important KPI in social media slots neatly into one of three core pillars: Reach, Engagement, and Conversion. Getting your head around this simple framework is the first step toward building a measurement strategy that actually tells you a complete, coherent story about your performance.
Think of these pillars as the natural stages of building a relationship. First, people have to notice you exist (Reach). Then, they need to interact and show they're interested (Engagement). Finally, some of them will take a meaningful step that helps your business (Conversion).
If you only focus on one, you're missing the bigger picture. A balanced strategy that accounts for all three is how you build real momentum, not just make noise.
To make this crystal clear, here’s a quick breakdown of how these three pillars work together.
The Three Pillars of Social Media KPIs
| KPI Pillar | What It Measures | Example Metrics |
|---|---|---|
| Reach | How many unique people are seeing your content. | Impressions, Follower Count, Audience Growth Rate, Post Reach |
| Engagement | How the audience is actively interacting with your content. | Likes, Comments, Shares, Clicks, Mentions |
| Conversion | How many people take a desired action that drives business value. | Click-Through Rate (CTR), Leads Generated, Sales Revenue, Cost Per Click (CPC) |
By tracking metrics across all three categories, you get a holistic view of your performance, from initial awareness right through to bottom-line impact.
Pillar 1: Reach KPIs
Reach is all about visibility. It’s the top of your funnel and answers one simple question: How many eyeballs are on our content? This is your potential audience, the total number of people your message gets in front of.
Measuring your reach helps you gauge brand awareness and see if your content distribution is actually working. Without a solid foundation of reach, the other two pillars simply can't deliver.
Key metrics to watch here include:
- Impressions: The total number of times your content appeared on a screen.
- Follower Count: The number of people who’ve opted in to see your posts.
- Audience Growth Rate: How quickly your follower count is climbing over time.
- Post Reach: The number of unique individuals who saw a specific post.
Key Insight: Reach KPIs are your visibility gauge. They don't measure the quality of the interaction, but they do confirm that your message is cutting through the noise and landing in front of your target audience.
Pillar 2: Engagement KPIs
Okay, so people are seeing your content. The next logical question is: Do they actually care?
That’s where engagement KPIs come in. They measure how your audience is actively interacting with what you post, showing you whether your content is truly hitting the mark. High engagement is the hallmark of a healthy, interested community. It’s the difference between shouting into the void and having a real conversation.
The classic engagement KPIs you'll want to track are:
- Likes, Comments, and Shares: The bread and butter of social interaction, showing your content sparked a reaction.
- Clicks: The number of times people clicked a link, your profile, or the content itself.
- Mentions: How often your brand is being tagged or talked about by others.
Tracking these numbers is essential for fine-tuning your content strategy and building stronger relationships with your followers. You can explore a wider variety of KPIs in social media in our guide to get a complete picture.
Pillar 3: Conversion KPIs
This is where the rubber meets the road. Conversion KPIs connect your social media activity directly to tangible business results. They answer the million-dollar question: Is all this effort actually driving outcomes?
This is about tracking how many people take a specific, valuable action after seeing your content. For a market like Germany, where over 67.8 million people use social media, figuring out which platforms drive these actions is vital. While WhatsApp leads in usage, other platforms are often where conversions happen, especially since 95.1% of users access social media on mobile devices. You can read more about the German social media market on veracontent.com.
Conversion KPIs are what prove the ROI of your social strategy. The most common ones include:
- Click-Through Rate (CTR): The percentage of people who saw your post and clicked a specific link.
- Cost Per Click (CPC): On paid ads, this is the price you pay for each click.
- Leads Generated: The number of potential customers you captured via a form or landing page from social.
- Sales Revenue: The holy grail—tracking sales that can be directly attributed back to your social channels.
How to Choose KPIs That Actually Matter

Chasing vanity metrics like follower count is a classic rookie mistake. It feels good to see that number go up, but without a clear purpose, it’s like driving without a destination—you're moving, but you aren't actually getting anywhere. The most effective KPI in social media is always, without fail, the one that’s directly tied to a real business objective.
This goal-first approach stops you from drowning in data just for the sake of it. It forces every metric you track to answer a simple question: "Is this helping the business grow?" Think of it this way: your business goal is the "what," and your KPI is the "how we'll know we're getting there."
Aligning KPIs with Business Goals
The first step is to get brutally honest about what you're trying to achieve with social media. Are you a brand-new business trying to get your name out there? Or are you an established e-commerce store focused on shifting products? Your answer completely changes which numbers you should care about.
Let's walk through a couple of common scenarios to see how this works in the real world. Each goal demands a totally different set of KPIs to measure success properly.
-
Goal: Increase Brand Awareness
Your mission here is simple: reach as many relevant people as humanly possible. You want to become a familiar face in your industry. In this case, your best friends are the Reach KPIs.- Primary KPIs: Post Reach, Impressions, Audience Growth Rate.
- Why they matter: These numbers give you a direct measure of how many unique eyeballs are seeing your content and how quickly your potential audience is expanding. It's all about footprint.
-
Goal: Generate More Leads
Now, the focus shifts to moving people from casually scrolling on social media into your sales funnel. You need to capture their details so you can start a proper conversation. This is where Conversion KPIs really shine.- Primary KPIs: Click-Through Rate (CTR), Form Submissions, Cost Per Lead (CPL).
- Why they matter: These metrics track the journey from a social post to a tangible lead, showing you exactly how well your content persuades people to take that crucial next step.
By linking every single KPI to a business objective, you transform your social media reporting from a simple activity log into a powerful strategic tool that proves its value.
Keeping Your KPIs Relevant and Actionable
Don't think the work is done once you've picked your KPIs. Your goals will change over time, and your measurement strategy has to adapt right along with them.
A KPI is only useful if it helps you make a decision. If your engagement rate is in the gutter, what are you going to do about it? Maybe it's time to A/B test different content formats. If your cost per lead is through the roof, what's the plan? You might need to refine your ad targeting.
This is what makes the data truly valuable. You can learn more about connecting metrics to real-world outcomes by exploring the different key performance indicators for social media that smart businesses use to guide their strategies. At the end of the day, the right KPIs are the ones that don't just sit in a report—they inspire action and drive constant improvement.
Essential Tools for Tracking Your KPIs
Trying to measure any KPI in social media without the right tools is like trying to build furniture without a tape measure. You might get something that looks right, but you'll have no idea if it actually fits. Fortunately, you don't need a huge budget to get a solid toolkit.
The best place to start is usually with the tools already at your fingertips. Every major social platform has its own free, built-in analytics dashboard, and these are your first port of call for checking performance right at the source.
Start with Native Analytics
Think of native analytics as the instrument panel that comes standard with your car. It gives you all the crucial information you need for day-to-day operations—no extra cost, no complicated setup.
These platforms provide a goldmine of data specific to their own environment:
- Meta Business Suite: This is your one-stop shop for Facebook and Instagram. It tracks everything from post reach and engagement rates to detailed audience demographics and video performance.
- X (formerly Twitter) Analytics: Here, you can break down your tweet activity, seeing exactly how many impressions you’re getting, who’s visiting your profile, and what content is hitting the mark.
- LinkedIn Analytics: Perfectly suited for its professional audience, this dashboard provides data on visitor demographics, content engagement, and follower growth for your personal profile and company page.
For small businesses or marketers just starting out, these free resources are more than enough. They give you the foundational data you need to stop guessing and start making smarter decisions about your content.
Level Up with All-in-One Platforms
As your social media presence expands, hopping between different native dashboards becomes a real time-drain. That's where dedicated, third-party platforms come in. They act as a central command centre, pulling all your social media data into one place.
Investing in an all-in-one tool is often the turning point where a brand moves from simply tracking metrics to generating powerful, cross-channel strategic insights.
Tools like Sprout Social or Hootsuite gather data from all your profiles into a single, unified dashboard. This makes it incredibly easy to compare performance across different networks, generate comprehensive reports, and frankly, save a tonne of time. They also offer deeper analytics, competitor analysis, and social listening features that you just can't get from the native tools.
Connect Social to Your Website with Google Analytics
Finally, to really understand your return on investment, you have to bridge the gap between your social media activity and your website's performance. This is where Google Analytics 4 (GA4) becomes your best friend, showing you what happens after someone clicks a link in your post.
By linking your social channels to GA4, you can trace a user's entire journey.
This kind of dashboard view clearly shows which social platforms are driving traffic and, more importantly, how engaged that traffic is once it lands on your site. When you set up conversion goals in GA4, you can directly attribute leads, newsletter sign-ups, and even sales back to specific social media campaigns. That's how you get undeniable proof of your social media ROI.
Turning Social Media Data into Actionable Insights
Collecting data on your social media KPIs is just the first step. Raw numbers are a bit like a pile of uncooked ingredients; they don't mean much on their own. The real magic happens when you turn that data into a clear story that tells you exactly what to do next.
This is all about moving past simply listing stats in a spreadsheet. Your job is to create a narrative. What are your engagement rates telling you about your content? What does your reach data reveal about how visible your brand is? This is how you transform dry metrics into a powerful strategic tool.
Building a Report People Will Actually Read
An effective report answers the "so what?" question for every single data point. Don't just show that a post got 500 likes; explain why it did so well and what you can learn from that success. A simple, consistent structure is your best friend here.
A solid reporting process really comes down to a few key steps:
- Establish a Rhythm: Set a consistent reporting schedule. This could be weekly for your internal team or monthly for key stakeholders. A regular cadence makes it easier to spot trends over time.
- Visualise Your Data: Use simple charts and graphs. A line graph showing audience growth is instantly more understandable than a list of numbers. Visuals help the important patterns jump right off the page.
- Add Context: This is the most important part. Always explain the "why" behind the numbers. Did a spike in traffic come from a particular campaign? Did engagement dip during a holiday week?
Your report’s main job is to connect performance data to your business goals. It should clearly highlight what’s working, pinpoint what isn’t, and—most importantly—recommend specific next steps for improvement.
From Analysis to Action
Insights are only valuable when they lead to action. Every piece of data should spark a question about your strategy. If your click-through rate on a specific ad is low, what can you change? Maybe the call-to-action isn't strong enough, or perhaps the visual just isn't grabbing attention.
Think about the ever-shifting social media world in Germany. In early 2025, Facebook's potential ad reach grew by 2.3%, only to drop by 4.9% a few months later. That kind of volatility shows why static reports aren't enough; you have to constantly analyse trends to stay ahead. You can dig into more digital trends in Germany on datareportal.com.
Ultimately, tracking any KPI in social media and gathering these insights is all in service of one thing: effective campaign optimization strategies. By turning your data into a clear story with actionable takeaways, you ensure your social media efforts are always getting better.
Got Questions About KPIs? Let’s Clear Things Up.
Diving into social media measurement can feel like wading into muddy waters. Even when you think you have a handle on it, some of the core concepts can be surprisingly tricky. Let's tackle some of the most common questions that pop up around social media KPIs, so you can move forward with a clearer, more confident strategy.
We’ll break down the classic "metric vs. KPI" debate, figure out how to set goals that aren't just wishful thinking, and decide on a reporting rhythm that actually makes sense for your team. The aim here is to cut through the jargon and get you some straight answers.
What’s the Real Difference Between a Metric and a KPI?
This one trips up a lot of people, but it’s actually pretty simple once you break it down. Think of it this way: pretty much everything you can count on social media is a metric. Likes, comments, shares, follower counts, video views—they're all just raw data points. They're the individual bricks.
A Key Performance Indicator (KPI), on the other hand, is a metric you've hand-picked for a very specific reason: it directly shows you whether you're getting closer to a major business goal. It’s not just any brick; it’s a load-bearing one that holds up your entire strategy.
A simple way to remember it: All KPIs are metrics, but only the most important, goal-driven metrics get to be called KPIs. A 'like' is a metric. A 'lead generated from a LinkedIn post' is a KPI if your goal is to fill your sales pipeline.
Making this distinction is what stops you from drowning in data or chasing vanity metrics that look impressive but don't actually help your business grow. When you focus on a few select KPIs, you know your efforts are pointed squarely at what matters most.
How Do I Set Realistic Benchmarks for My KPIs?
Setting the right targets is a bit of an art, but it’s one that should always be grounded in solid data. Pulling a number out of thin air is a fast track to disappointment. A smarter approach involves looking in three directions to get a complete picture.
A good benchmarking process looks like this:
- Look Inward: Your own history is your best teacher. Dig into your past performance. What was your average click-through rate over the last six months? What’s your typical cost per lead? This baseline is the most reliable place to start.
- Look Outward: Now, zoom out and look at your industry. Plenty of marketing analytics firms and publications release reports on average engagement rates and other key metrics for different sectors. This gives you crucial context for what's considered normal, good, or great in your field.
- Look Sideways: Finally, take a good look at your direct competitors. You won't have access to their private analytics, of course, but you can see a lot from the outside. Track their follower growth, see which posts get the most public engagement, and observe their overall content strategy. This keeps your goals grounded in the reality of the market you're competing in.
When you blend insights from these three sources—your own data, industry standards, and competitor activity—you can set benchmarks that will stretch your team without breaking them.
How Often Should I Be Reporting on My Social Media KPIs?
There’s no magic number here. The right reporting schedule depends entirely on who’s reading the report and what they need to do with the information. You have to match the cadence to the audience.
Think about it in these terms:
- Weekly Reports: These are for the people in the trenches—the social media manager or the marketing team executing the campaigns. A weekly check-in is perfect for making quick, tactical adjustments. You can see what’s working right now and double down, or pull the plug on something that’s failing.
- Monthly Reports: This cadence is usually the sweet spot for department heads and key stakeholders. It’s frequent enough to spot important trends but broad enough to smooth out the daily noise. A monthly report gives a solid read on the overall health and direction of your social strategy.
- Quarterly Reports: These are for the C-suite and high-level strategy sessions. A quarterly review provides the big-picture view needed to assess long-term impact, calculate return on investment (ROI), and make major decisions about future budgets and strategic direction.
So, What’s the Single Most Important KPI for Social Media?
This is the ultimate trick question, because there isn't one. The honest-to-goodness answer is always: it depends entirely on your business goals. The "best" KPI is simply the one that gives you the clearest signal that you’re succeeding at your primary objective.
For example:
- A new brand trying to get its name out there will be obsessed with Reach and Impressions. That's their most critical KPI.
- An online shop is going to live and die by its Conversion Rate from social ads and its Return on Ad Spend (ROAS).
- A B2B consultancy using LinkedIn for business development will have its eyes glued to its Cost Per Lead (CPL).
A KPI gets its power from its direct link to a business outcome. Your most important KPI this quarter might be different from your most important one next year as your business evolves. And that's exactly how it should be.
Ready to stop guessing and start creating on-brand content that hits your goals every time? Trustypost is an AI-powered social media ghostwriter that learns your voice and generates daily post ideas, so you can stay consistent, look professional, and turn your social media presence into a lead-generating machine. Start your 7-day free trial today at https://trustypost.ai.