
Let's talk about social media KPIs. Think of them as the specific, measurable numbers you use to see if your social media strategy is actually working towards your business goals. Unlike general metrics that just tell you something is happening, KPIs are directly tied to tangible outcomes, like generating leads or building a loyal customer base. They turn abstract data into a clear roadmap for success.
Why Most Social Media Metrics Are Misleading
Let’s be honest, many of the numbers you see on your social media analytics dashboard are just noise. It's easy to get lost in a sea of data, with dozens of metrics all screaming for your attention. But which ones really matter?
Think of it like driving a car. Your dashboard shows your speed, fuel level, engine temperature, and maybe the song playing on the radio. Your speed and fuel level are your Key Performance Indicators (KPIs) – they’re critical for getting you to your destination safely and on time. The song on the radio? That's just a metric. It's nice information, but it has zero impact on whether you reach your goal.
Distinguishing Signal From Noise
The same idea applies to social media. Many metrics are interesting to look at but are ultimately distracting. We often call these "vanity metrics" because they look great on a report but don't actually translate into real business impact.
- Likes: A post with thousands of likes feels fantastic, but did any of those people click through to your website or make a purchase?
- Follower Count: A massive follower list is impressive, but it’s a hollow number if most of those accounts are inactive or aren’t your ideal customer.
- Impressions: Knowing your content was seen millions of times is exciting, but it doesn't tell you if the right people saw it or if they did anything about it.
These numbers simply lack context. They don't connect your social media activity to what your business is trying to achieve. Relying solely on them is like trying to navigate a cross-country road trip by only paying attention to the radio volume.
Focusing on What Truly Matters
The only way to prove social media’s value—and justify your marketing budget—is by zeroing in on social media KPIs that are explicitly linked to your business objectives. These performance indicators bring clarity and direction, helping you make smart, data-backed decisions instead of just guessing what works. If you want to explore this further, our guide on choosing the right social media performance indicators can offer more detailed insights.
A metric tells you what happened; a KPI tells you if what happened actually helped you achieve a business goal. Shifting your focus from vanity metrics to meaningful KPIs is the first step toward building a strategy that delivers real, measurable results.
To make this distinction crystal clear, here’s a breakdown of how a simple metric evolves into a powerful KPI when it’s connected to a purpose.
The Difference Between Metrics and KPIs
| Category | Example Metric | Example KPI (Tied to a Goal) | Business Goal |
|---|---|---|---|
| Awareness | Post Impressions | Reach within Target Audience | Increase brand visibility among qualified prospects. |
| Engagement | Likes & Comments | Engagement Rate on Campaign Posts | Drive meaningful conversations around a new product. |
| Conversion | Website Clicks | Click-Through Rate (CTR) on a CTA | Generate leads from a specific social media campaign. |
| Advocacy | Shares & Mentions | Share of Voice vs. Competitors | Establish industry authority and brand preference. |
See the difference? Instead of just tracking likes, a true KPI would be the engagement rate on posts specifically designed to spark conversation. Instead of just celebrating follower growth, a much better KPI would be the conversion rate of traffic coming from social media to your product landing page.
This strategic shift transforms your social media reporting. It goes from being a list of disconnected numbers to a powerful story about growth, customer loyalty, and return on investment. It gives you the solid proof you need to show that your efforts aren't just creating buzz—they're building your business.
Building Your Social Media KPI Framework
Drowning in data is a feeling every marketer knows well. The secret isn't to track every vanity metric under the sun, but to build a framework that organises the numbers into a story you can actually understand. A solid KPI framework cuts through the noise and helps you measure what genuinely moves the needle for your business.
Think of it like building a balanced financial portfolio. You wouldn't throw all your money into a single, volatile stock. Likewise, you shouldn't pin all your hopes on one type of metric, like follower count. A truly effective framework gives you a complete view of the entire customer journey, from the first time someone sees your brand to the moment they become a loyal fan.
This structured approach helps you see the bigger picture, connecting your day-to-day social media posts directly to your most important business goals. It draws a clear, straight line from a single tweet or Reel to your company's bottom line.
The Four Pillars of a Strong KPI Framework
A brilliantly simple way to get organised is to group your social media KPIs into four logical categories. Each pillar represents a different, crucial stage of your audience's relationship with your brand, giving you a 360-degree view of your performance.
These categories are:
- Reach: These KPIs are all about the size and growth of your potential audience. They answer the question: "How many people are we actually getting in front of?"
- Engagement: This is where you track how people are interacting with your content. It tells you: "Are people connecting with what we're sharing, or are they just scrolling past?"
- Conversion: Here's where the rubber meets the road. These are the metrics tied directly to business results, like sales and leads. They answer: "Are our social media efforts driving real action?"
- Loyalty: The final pillar is about long-term brand health and customer happiness. It helps you understand: "Are we building a community of dedicated advocates?"
Organising your dashboard this way creates a narrative. You can clearly see how expanding your reach leads to better engagement, which in turn drives more conversions and, ultimately, builds a loyal following. This interconnected view is the foundation of any successful social media content strategy.
This diagram shows how your high-level business goals should be the starting point, dictating which KPIs you focus on.
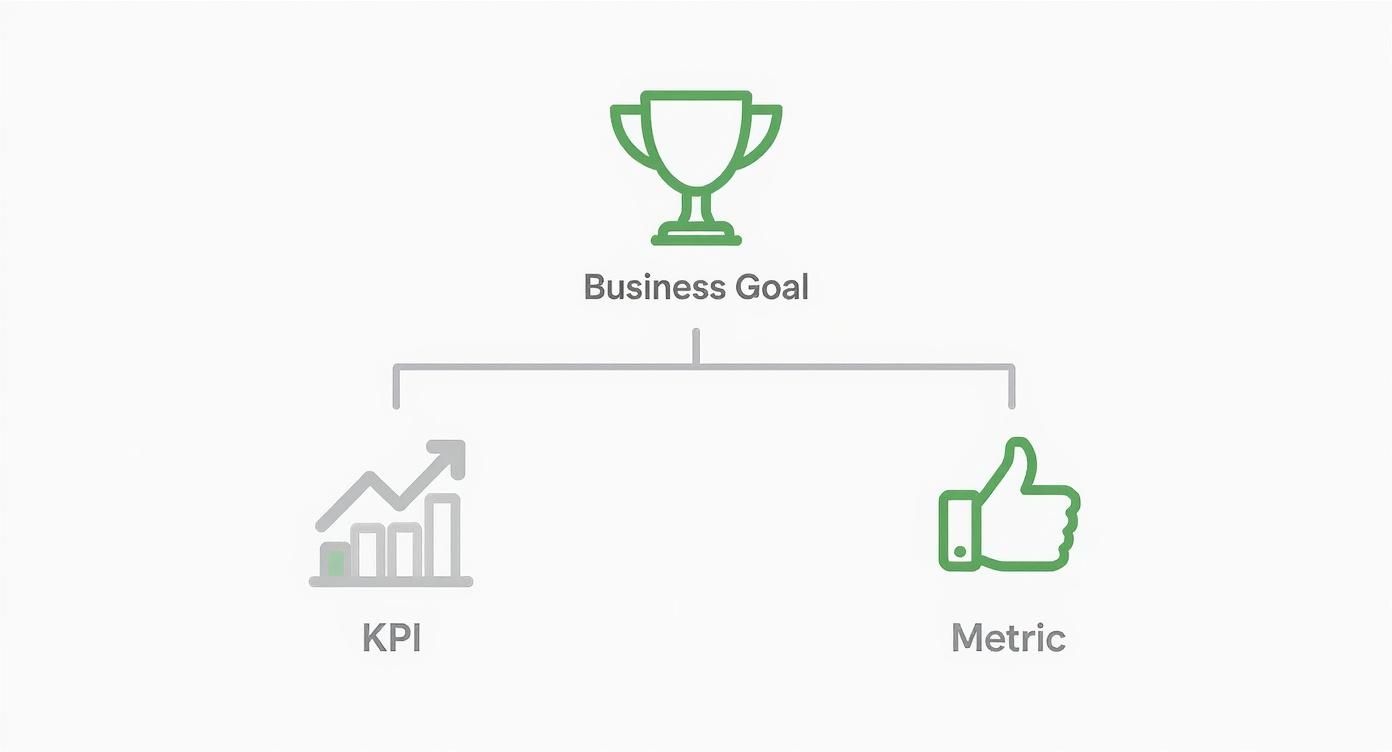
As the visual makes clear, your main business goal is the foundation. From there, you can choose specific, measurable KPIs to track your progress towards that goal.
To make this even clearer, here’s a breakdown of the most important KPIs within each of those four pillars.
Key Social Media KPIs by Category
This table lays out the essential KPIs for each category, giving you a clear roadmap for what to track and why it matters.
| Category | Primary KPI | Secondary Metrics | What It Measures |
|---|---|---|---|
| Reach | Follower Growth Rate | Impressions, Potential Reach, Audience Share | The size and expansion of your potential audience over time. |
| Engagement | Engagement Rate | Likes, Comments, Shares, Saves, Applause Rate | How actively and meaningfully your audience interacts with content. |
| Conversion | Click-Through Rate (CTR) | Conversion Rate, Cost-Per-Click (CPC), Leads, Sales | The effectiveness of social media in driving desired user actions. |
| Loyalty | Customer Satisfaction (CSAT) | Brand Mentions, Net Promoter Score (NPS), Reviews | Long-term brand health and the strength of your community. |
By using a structure like this, you ensure you're not just collecting random numbers but are monitoring a balanced set of metrics that tell the whole story of your social media performance.
Connecting KPIs to Business Growth
Each of those pillars contains KPIs that give you real, actionable insights. For example, under Reach, you'd be watching your follower growth rate and impressions. For Engagement, engagement rate and comments per post are your go-to metrics. Conversion KPIs would include essentials like click-through rate (CTR) and cost-per-acquisition (CPA). And finally, Loyalty could be measured through customer satisfaction scores (CSAT) and brand mentions.
The explosive growth of social media advertising in Germany and across Europe really underscores why these frameworks are so vital. With global social media ad spend projected to hit a massive $219.8 billion in 2025—and Meta’s platforms still dominating—the stakes are high.
Here in Germany, we're seeing increased ad spend on platforms like Instagram and TikTok, driven by engaging formats like Reels. This makes social media KPIs such as CPM (cost per thousand impressions) and CPC (cost per click) absolutely critical for advertisers. When building your framework, it’s also smart to understand the broader context of general marketing performance metrics. Constant shifts in ad costs and ongoing data privacy challenges mean a structured KPI framework is no longer a "nice-to-have"—it's a necessity for running efficient campaigns in the German market.
By categorising your KPIs, you're not just collecting data; you're building a diagnostic tool. A dip in engagement can be an early warning sign, while a spike in conversions can validate a new campaign approach, allowing you to adapt your strategy with confidence.
In the end, a well-built framework makes sure every piece of data you track has a purpose. It transforms a confusing spreadsheet into a strategic dashboard that guides your decisions and proves the real-world value of your social media efforts to the rest of your organisation.
Mastering Your Reach and Awareness KPIs
Before anyone can become a customer, they have to know you exist. It’s a simple truth, but it’s the whole point of Reach and Awareness KPIs. These are the foundational metrics that tell you just how big your brand's footprint is online.
Think of it like this: if your content is a message in a bottle, Reach tells you how many different shores it has washed up on. It’s the unique number of people who lay eyes on your content, giving you a real sense of your potential audience size.
But reach alone doesn't paint the whole picture. For that, you need to look at its close cousin, impressions.
Understanding Reach Versus Impressions
It's easy to mix these two up, but they measure two very different things. Getting this distinction right is key, otherwise, you could end up making strategic decisions based on the wrong data.
-
Reach: This is the total number of unique individuals who saw your post. If 1,000 different people see your content, your reach is 1,000. It’s all about the breadth of your audience.
-
Impressions: This is the total number of times your post was seen. If those same 1,000 people see your post an average of three times each, you’ll have 3,000 impressions. This metric is all about frequency.
So, what does this mean in practice? A high impression count with low reach could mean your content is being shown repeatedly to a small group of loyal followers. On the flip side, high reach with low impressions suggests you're hitting lots of new people, but maybe not often enough for your brand to stick. Neither is inherently good or bad; they just tell different stories.
Going Deeper with Strategic Awareness KPIs
While reach and impressions are the bread and butter of awareness, a truly effective strategy digs deeper. You need KPIs that provide context, track growth, and measure your position against the competition. These indicators help you understand not just how visible you are, but how your visibility is changing over time.
Measuring awareness isn't just about counting views. It’s about understanding your brand's presence in the digital conversation and identifying opportunities to grow your share of that conversation.
A few key strategic KPIs to add to your dashboard include:
-
Follower Growth Rate: This shows you the speed at which you’re attracting new followers. Forget just looking at the raw follower count; this metric puts your growth into perspective by comparing it to your existing audience size.
-
Web Traffic from Social: This KPI directly tracks how many people click a link from your social profiles and land on your website. It's a fantastic measure of how well your social media presence sparks genuine interest in your brand's home base.
-
Share of Voice (SOV): This is a powerful one. SOV measures your brand's visibility compared to your competitors. By tracking how often your brand is mentioned versus your rivals, you get a clear benchmark of your influence in the market.
In Germany, keeping an eye on platform penetration is another vital KPI. For instance, Facebook’s huge usage across Europe (over 75% in most markets) makes it a critical channel for maximising reach. As social commerce continues to grow on platforms like Instagram, these awareness metrics become the crucial first step in a much longer customer journey. You can find more insights on this by exploring the 2025 social media landscape in Europe on ntamgroup.com.
By tracking this mix of KPIs, you can build a strategy that doesn’t just get you seen, but gets you remembered.
Tracking The Engagement and Conversion KPIs That Really Matter
Getting your brand seen is one thing, but getting people to act is another. While reach and awareness KPIs lay the groundwork, the real magic happens with engagement and conversion metrics. This is where your social media strategy starts to pay off in tangible ways.
Think of it this way: visibility is great, but action is what drives growth. These social media KPIs are the bridge between someone simply seeing your content and taking a meaningful step that benefits your business. We're moving beyond passive views to measure genuine interest and, ultimately, business results.
Demystifying Engagement Rate
Engagement Rate is easily one of the most powerful KPIs in your toolkit. Why? Because it tells you how much your audience is actually interacting with your content, relative to its size. A high engagement rate is a sign of a healthy, interested community—not just a massive, silent one.
But here’s a crucial point: not all engagement rate calculations are created equal. You need to know which one to use and when.
- Engagement Rate by Followers: This is the classic formula: take all the engagements on a post (likes, comments, shares, saves) and divide them by your total follower count. This method is brilliant for getting a pulse check on the general interest level of your established community.
- Engagement Rate by Reach: Here, you divide the total engagements by the post's unique reach. This is often a truer measure of your content's quality because it reveals how engaging a post was to the people who actually saw it, whether they follow you or not.
To really get the most out of your analysis, it’s vital to understand what engagement rate is and why it matters on a deeper level. Choosing the right calculation helps you tell a more accurate story about your performance.
From Likes to Leads: The Conversion Connection
High engagement is fantastic, but its real power is unlocked when it leads to conversions. This is the moment where a simple interaction transforms into a measurable business outcome, like website traffic, new leads, or even sales. Two KPIs are absolutely essential for tracking this journey.
First up is Click-Through Rate (CTR). This is the percentage of people who see your post and click on the link you’ve included. It’s your most direct measure of how well your content inspires people to leave the social platform and explore what you have to offer.
A low CTR often points to a mismatch between your creative and your call-to-action (CTA). Maybe the copy wasn’t persuasive enough, or the link got lost in the shuffle. Digging into your CTR helps you fine-tune your message for maximum impact.
The journey from a simple "like" to a completed sale begins with a single click. Your CTR is the KPI that measures the strength of that crucial first step, turning passive interest into active intent.
Measuring True Business Impact: Conversion Rate
While CTR measures interest, Conversion Rate measures action. This is the big one. This KPI tracks the percentage of users who, after clicking your link, go on to complete a specific goal on your website or landing page. This is the ultimate test of your social media ROI.
What counts as a "conversion" is entirely up to you and your business goals.
- For an e-commerce brand: A completed purchase.
- For a B2B company: A filled-out lead form or a whitepaper download.
- For a service business: A booked consultation or a webinar sign-up.
This is where you can clearly see the financial impact of your social strategy. In Germany, for example, social media significantly shapes consumer behaviour. Over 40% of Germans say Instagram has made them aware of a product they later bought, proving that the path from a post to a purchase is very real.
By meticulously tracking these conversion KPIs, you can draw a straight line from a specific social media post to a new lead or sale. This gives you undeniable proof that your efforts aren't just creating buzz—they're actively contributing to your bottom line.
Choosing the Right Tools to Track Your KPIs
Defining your social media KPIs is like picking a destination on a map. That’s a great first step, but you still need a way to get there. Without the right tools to track your progress, even the most brilliant KPIs are just wishful thinking. This is where a good set of tools comes in, transforming a sea of data into a clear roadmap.
Your tracking journey should always start with the tools you already have. Every major social media platform offers a surprisingly robust suite of free, built-in analytics. These native dashboards are your most direct and honest source of information for platform-specific performance.
Start with Native Analytics Dashboards
Before you even think about paying for software, get comfortable with the analytics provided directly by the platforms themselves. These tools are built for their own ecosystems, giving you a level of detail you often can't find anywhere else. They are the perfect, non-negotiable starting point for any social media manager.
For instance, Meta Business Suite gives you an incredible depth of insight into your Facebook and Instagram activity, from post reach right down to your audience demographics. LinkedIn Analytics offers detailed reports on your company page followers and content engagement, while TikTok Analytics is your go-to for video views, follower trends, and what’s currently popular.
Learning your way around these native tools is essential. They provide the raw data for your social media KPIs and help you understand what resonates on each channel individually. For a deeper dive into the specifics, a comprehensive guide to analytics for social media can really help sharpen your skills.
When to Use Third-Party Tools
Native analytics are fantastic, but they do have one major drawback: they don't talk to each other. If you're managing several platforms, constantly jumping between different dashboards to pull reports is a massive time sink. This is exactly when investing in a third-party tool stops being a luxury and becomes a smart strategic move.
Tools like Hootsuite, Sprout Social, or Buffer pull all the data from your different accounts into one unified dashboard. The advantages are immediate:
- Cross-Platform Reporting: You can easily see how a single campaign performed across Instagram, LinkedIn, and X (formerly Twitter) without juggling a dozen browser tabs.
- Time Savings: Let automated reports handle the grunt work. This frees you up to spend your time on what really matters—analysing the data and planning your next move.
- Competitive Analysis: Many of these platforms let you peek at what your competitors are doing, giving you valuable context for your own results.
The decision to invest usually comes down to scale. If you're managing more than two or three social channels, or if you need to present a clean, consolidated report to your boss or clients, a third-party tool is well worth the money.
Best Practices for Accurate Tracking
No matter which tools you use, your data is only as reliable as your tracking methods. There are two practices that are absolutely crucial for ensuring your KPI data is both accurate and useful, especially when you're trying to measure what happens after someone clicks a link.
First, get comfortable with using UTM parameters. These are just little snippets of code you add to the end of a URL. They act like tracking tags, telling your website analytics (like Google Analytics) exactly where a visitor came from. By tagging your links properly, you can directly attribute website traffic, leads, and even sales to a specific social media post.
Without UTM tracking, all your hard-earned social media traffic might just get lumped under "Direct" or "Referral." This makes it impossible to prove the true ROI of your work. It’s the single most important habit for connecting social media activity to real business results.
Second, build a simple reporting dashboard. This doesn't have to be some overly complicated software; a basic spreadsheet often does the trick beautifully. Your dashboard should visualise your key social media KPIs from month to month. This helps you spot trends, celebrate wins, and quickly pinpoint areas that need a bit more attention, turning raw numbers into a story you and your team can actually understand and act on.
Common KPI Mistakes and How to Avoid Them
Even the most experienced marketers can get tripped up when it comes to tracking social media KPIs. It’s surprisingly easy to set the wrong targets or read the data incorrectly, which can throw your whole strategy off track and burn through your budget. Recognising these common mistakes is the first step to building a measurement plan that actually works.
One of the biggest traps is chasing vanity metrics. Sure, a growing follower count looks great in a report, but it’s a hollow win if those followers never engage, click your links, or buy anything. A post that goes viral with thousands of likes but sends zero traffic to your website isn't a success—it's just a distraction. The goal isn’t simply to be seen; it’s to be seen by the right people who will actually do something.
Misinterpreting Data Without Context
Another classic error is looking at the numbers in a vacuum. A sudden spike in comments might seem like fantastic engagement, but what if they’re all from frustrated customers? Likewise, a drop in reach could look like a disaster until you realise it’s down to a platform-wide algorithm change that’s affecting everyone, not a flaw in your content.
Context is the lens through which you should view all your social media data. A number on its own is just a data point; a number with context becomes an insight that can guide your strategy.
To avoid this, you have to dig deeper. Look at the sentiment behind the comments, see how your performance stacks up against industry benchmarks, and keep an eye on platform updates. This ensures you’re reacting to real trends, not just statistical noise.
Sticking to Outdated KPIs
Finally, a lot of teams fall into the "set it and forget it" trap with their KPIs. Your business goals change over time, so why would your performance indicators stay the same? The KPIs that mattered for a brand awareness campaign last year will be totally different from the ones you need for a sales-focused product launch today.
Here are a few ways to keep yourself from making these common mistakes:
- Prioritise Action over Applause: Focus on metrics like Click-Through Rate (CTR) and Conversion Rate instead of just likes and followers. These are tied directly to real business outcomes.
- Ask "Why?" Five Times: When a number surprises you, don’t just take it at face value. Keep asking why until you get to the root cause, whether the news is good or bad.
- Schedule Regular KPI Reviews: Make it a quarterly habit to sit down and review your KPIs. This simple practice keeps your social media efforts perfectly aligned with where the company is headed.
By steering clear of these pitfalls, you can build a measurement framework that keeps everyone focused on what truly matters—driving tangible growth for your business.
Got Questions About Social Media KPIs? We've Got Answers.
When you first dive into social media KPIs, a lot of practical questions pop up. How often should you actually be checking your numbers? Do the KPIs that work for a clothing brand also work for a software company? Let's tackle some of the most common questions and get you set up with a smart, effective tracking routine.
How Often Should I Check My Social Media KPIs?
One of the first things people want to know is how frequently they should be glued to their analytics. The good news? You don’t need to live inside your dashboard. But you can't just set it and forget it for months, either. The sweet spot is finding a balanced rhythm that keeps you informed without making you sweat every tiny fluctuation.
Think of your reporting cadence as the heartbeat of your strategy. Checking too often makes you reactive, causing you to panic over small dips. Waiting too long means you’re flying blind, missing huge opportunities to pivot or double down on what’s working.
Here’s a sensible rhythm that most seasoned pros stick to:
- Weekly Check-ins: Pop in for a quick, 15-minute look at your short-term campaigns and engagement. This is your chance to spot what's buzzing with your audience in real-time.
- Monthly Reports: This is where you zoom out a bit and analyse the bigger trends. How's your follower growth looking? Are your conversion rates holding steady? This monthly pulse check tells you if your overall strategy is healthy.
- Quarterly Reviews: Time to get strategic. Take a step back and ask the big questions. Are the KPIs we’re tracking still lining up with our main business objectives? This is the perfect time to make bigger adjustments to your plan for the months ahead.
Do B2B and B2C Companies Use the Same KPIs?
Not exactly. While some metrics like engagement are universally useful, the priorities are completely different. The journey a customer takes from discovery to purchase is worlds apart for B2B and B2C, so your measurement has to reflect that reality.
For B2C (Business-to-Consumer) brands, it’s often a numbers game focused on broad awareness and quick, direct sales. Their key KPIs usually include:
- Engagement Rate: Building a big, lively community is everything.
- Conversion Rate: Are people actually clicking "buy" from that social post or ad?
- Reach and Impressions: The goal is to get the brand in front of as many eyes as possible.
For B2B (Business-to-Business) companies, the game is longer and more strategic. It's less about impulse buys and more about generating qualified leads and building trust. Their important KPIs often are:
- Click-Through Rate (CTR) to Gated Content: Getting people to download that whitepaper or sign up for a webinar is a massive win.
- Lead Conversion Rate: It's not just about clicks; it's about how many of those clicks turn into actual, qualified leads for the sales team.
- Share of Voice: Positioning the company as the expert in its field is a long-term play that pays dividends.
How Do I Set Benchmarks with No Past Data?
Starting from zero can feel a bit like shouting into the void, but it’s also a fantastic opportunity for a clean slate. Your goal in the beginning isn't to hit some lofty industry average; it's simply to establish your own baseline.
For the first 90 days, just focus on posting consistently and gathering data. That's it. Track your reach, engagement rate, and follower growth without passing any judgment.
After those three months, you’ll have your very own historical data. That, right there, is your first benchmark. From that point on, you can aim for steady, incremental improvements. Shooting for a 5-10% increase in your key metrics month-over-month is a realistic and motivating place to start. This way, your goals are always grounded in your own unique performance, not someone else's.
Ready to take the guesswork out of your social media? Trustypost is your AI-powered ghostwriter that generates on-brand content ideas daily, helping you stay consistent and professional. Start turning attention into leads and save hours every week with a free 7-day trial at https://trustypost.ai.